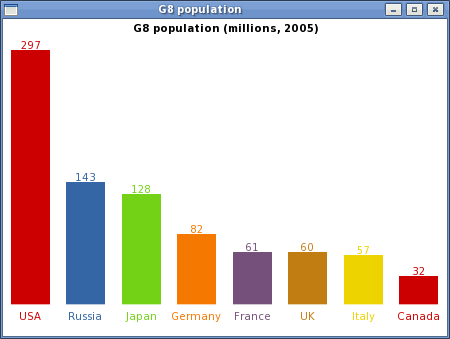
Example application using the BarChart widget (click to enlarge).
What is pygtkChart?
pygtkChart is a Python package that provides PyGTK widgets to simply integrate charts into a GTK application. Currently pygtkChart comes with four widgets:
- LineChart - for plotting graphs, statistical data etc.
- BarChart - shows a bar chart (see example on the right)
- MultiBarChart - like BarChart, but shows groups of bars
- PieChart - shows simple pie charts
The appearance of the widgets is highly customizable. All
bars, graphs or titles on a chart can be accessed and modified
separatly.
Colors, backgrounds and many more properties can be modified
for each object.
All objects are inherited from gobject.GObject so they live in the GTK main loop and can emit signals e.g. when a bar on BarChart has been clicked.
For downloads an installation instructions, please see the download page.
Authors/Contact
Sven Festersen (sven@sven-festersen.de)
John Dickinson (john@johnandkaren.com)
License
pygtkChart is free software. It's licensed under the terms and conditions of the General Public License .